 ar
ar bg
bg hr
hr cs
cs da
da nl
nl fi
fi fr
fr de
de el
el hi
hi it
it ko
ko no
no pl
pl pt
pt ro
ro ru
ru es
es sv
sv tl
tl iw
iw id
id lv
lv lt
lt sr
sr sk
sk sl
sl uk
uk vi
vi et
et hu
hu th
th tr
tr fa
fa ms
ms hy
hy ka
ka ur
ur bn
bn mn
mn ta
ta kk
kk uz
uz ku
ku
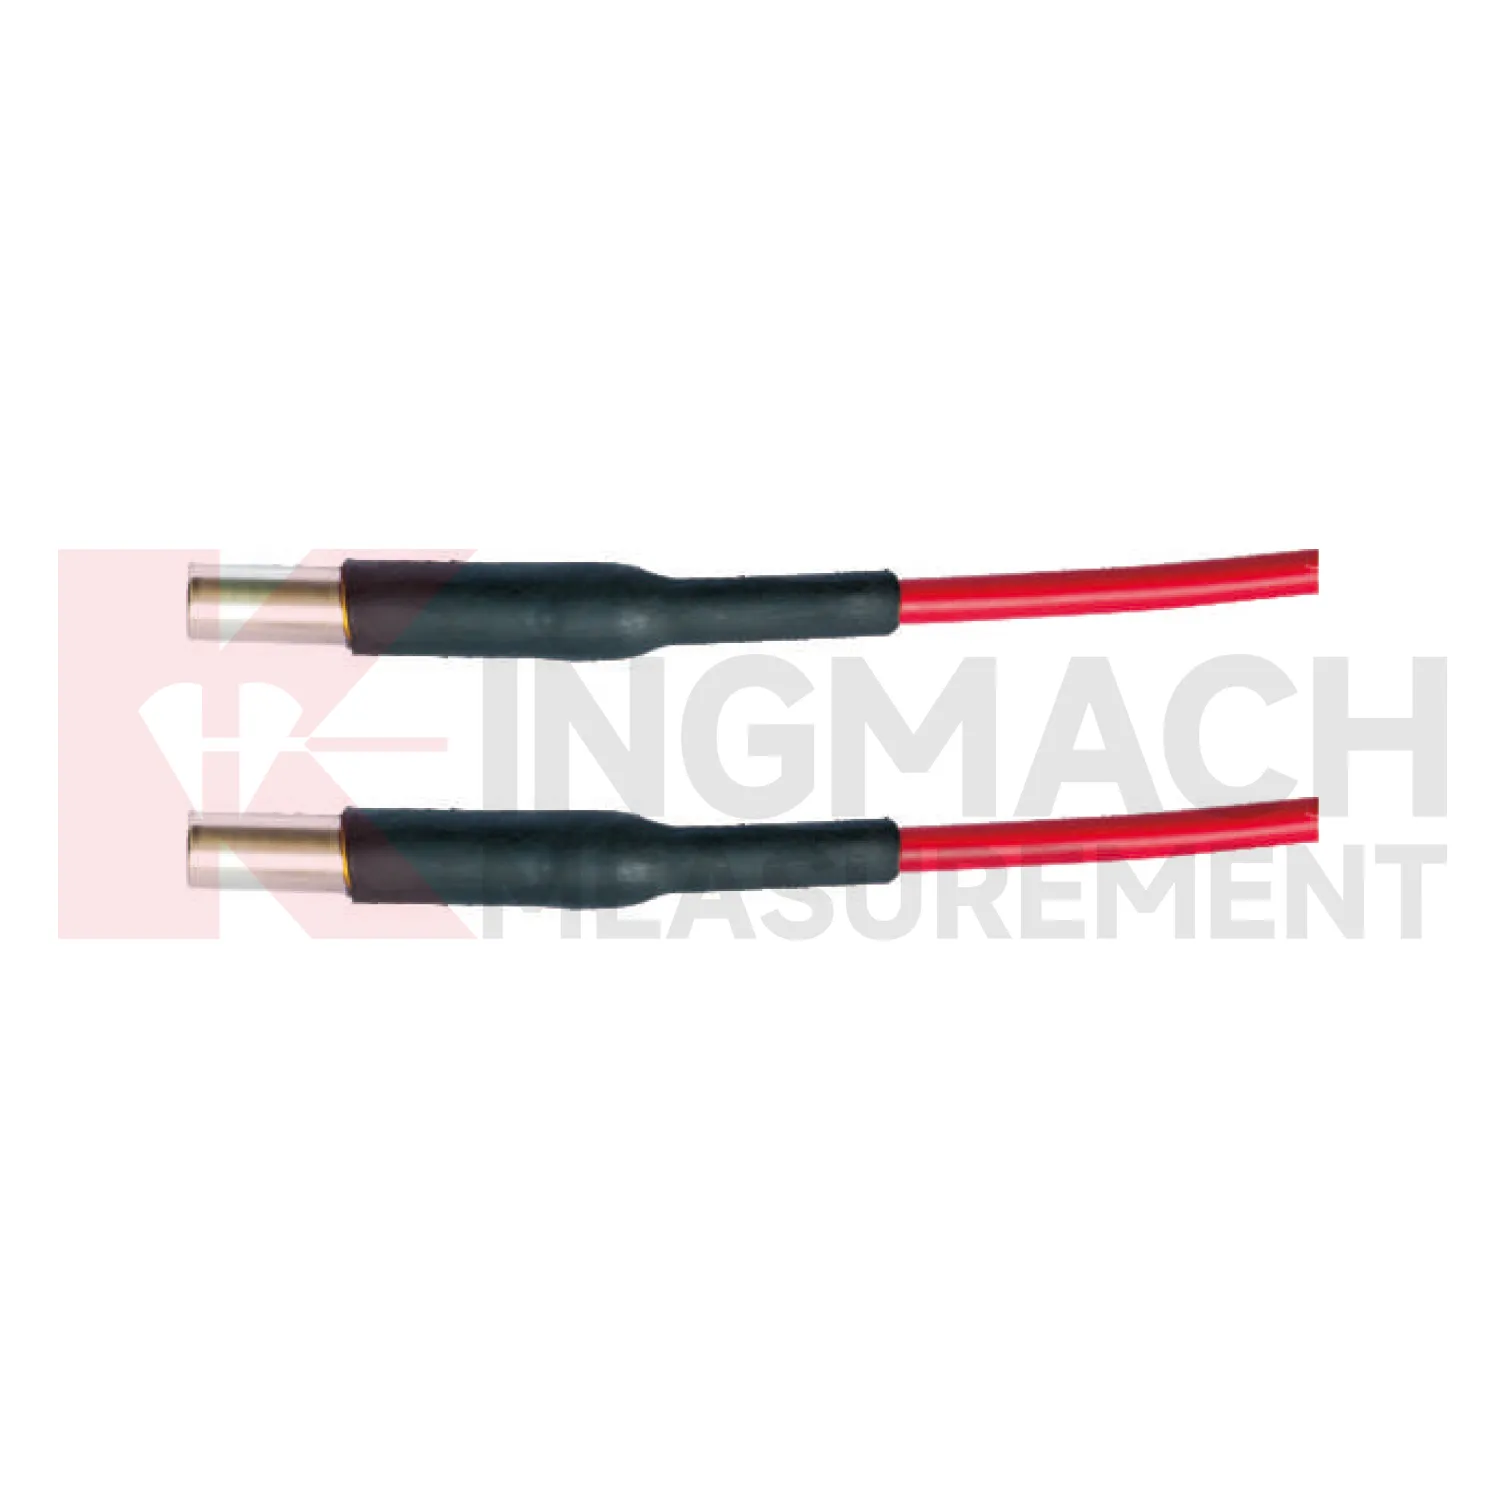
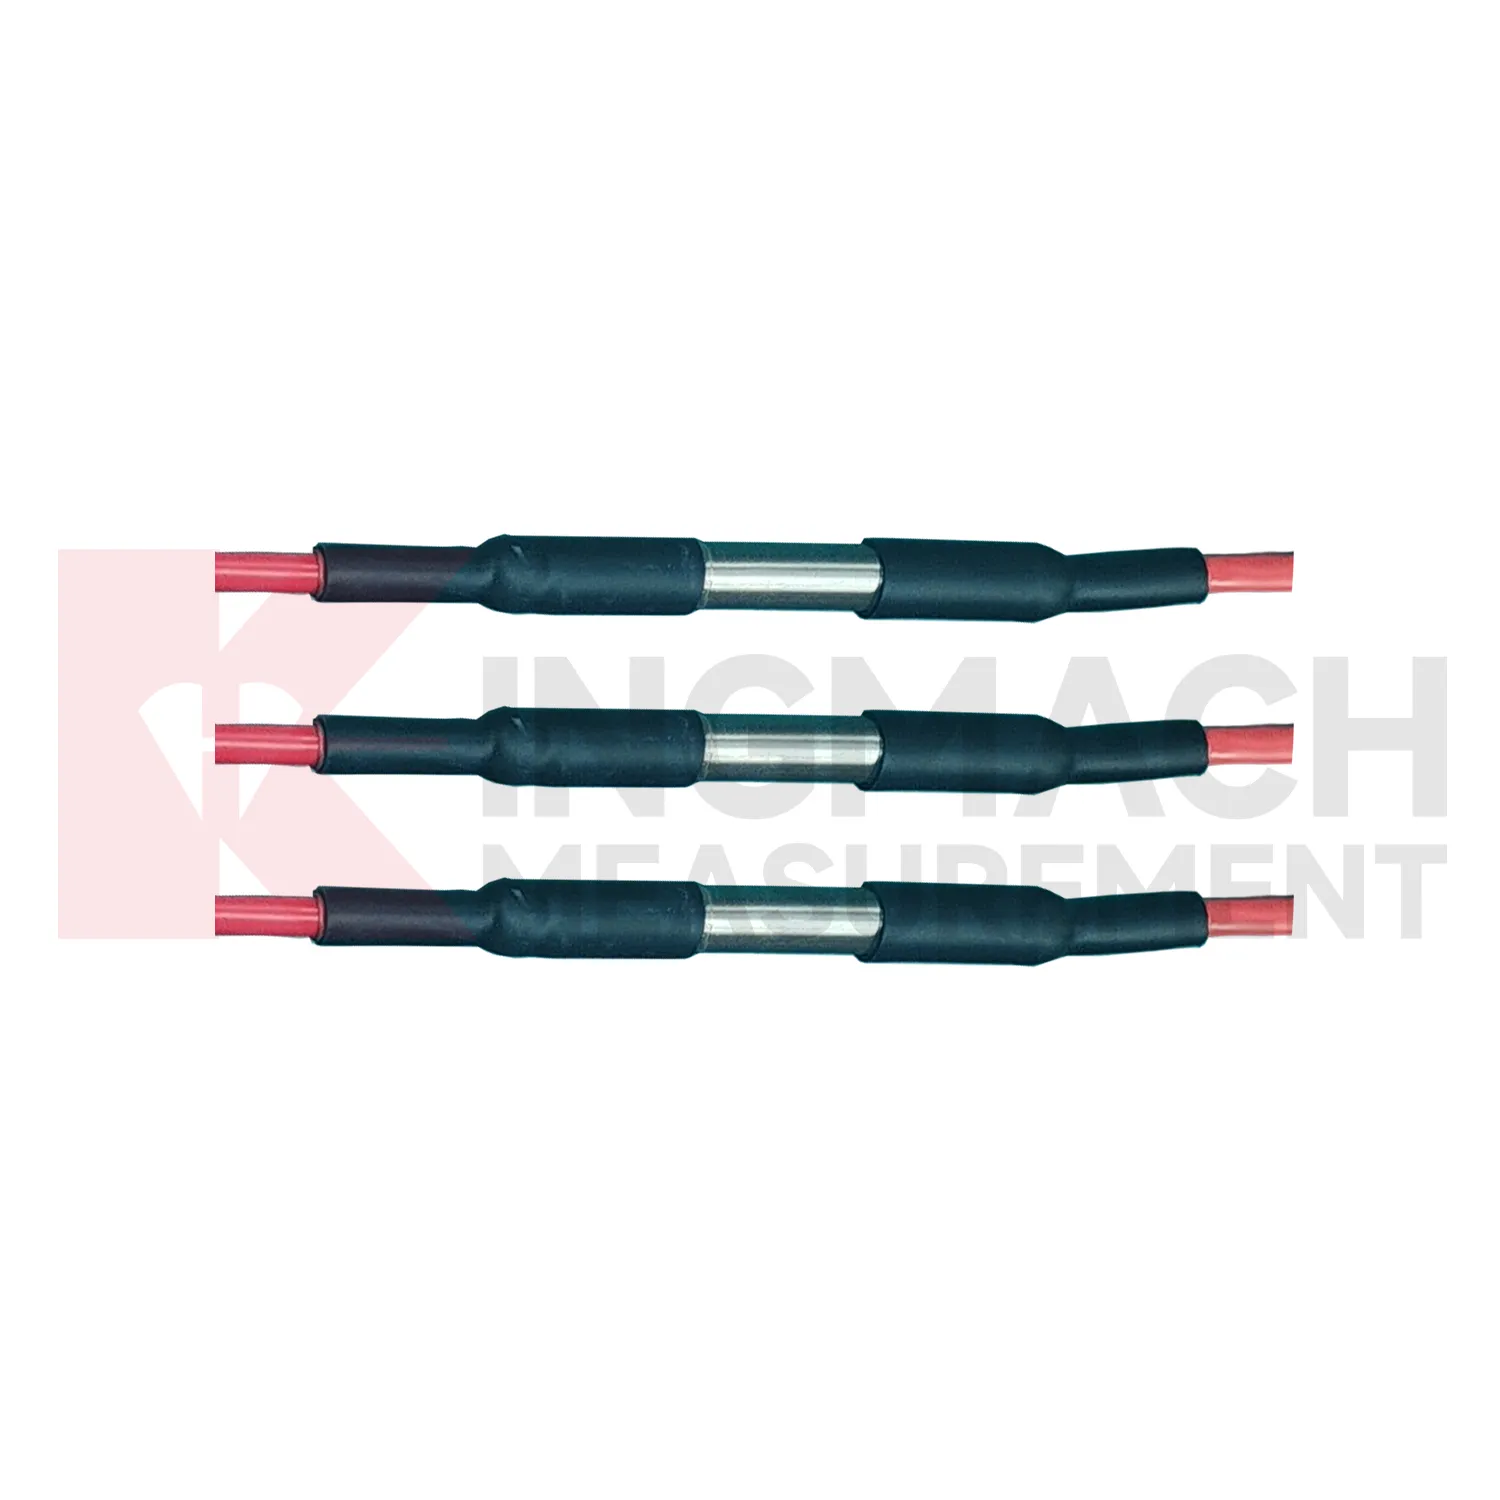
Daisy-Chained Digital Thermometer
Durability in Kingmach Daisy-Chained Digital Thermometer is not only a product property; it is a field practice. Outdoor stations face rain, dust, sun, wind, insects, corrosion, ice, and accidental impact. Buried points face soil movement, water, cable strain, and excavation risk. Indoor and underground points face condensation, heat, poor ventilation, and cable congestion. Enclosures, connectors, glands, poles, brackets, grounding, and drainage all affect whether the record stays usable. A durable station should be easy to inspect without disturbing the measurement. It should also have a visible maintenance history so a future reviewer knows whether a strange reading followed a storm, a repair, a cleaning visit, or a real environmental event. This is how field reliability becomes data reliability.
If the reading seems unusual, the team should check the physical condition of the station before drawing conclusions about the asset. Blockage, poor exposure, loose wiring, water entry, and changed surroundings can all create misleading patterns.
A practical report links the condition value with time, place, and action. It should help a reviewer decide whether to keep observing, inspect the field point, compare nearby instruments, or record the event as normal site behavior.
For owners, the strongest record is the one that remains understandable after staff changes. Clear units, plain point names, installation photos, maintenance notes, and linked structural channels make the data usable beyond the original project team.

Application of Daisy-Chained Digital Thermometer
Agriculture and irrigation projects use Kingmach Daisy-Chained Digital Thermometer to understand the relation between rainfall, irrigation, soil wetness, air conditions, and plant or ground response. The purpose is not just to display weather information. The record should help managers decide when soil is drying, whether irrigation reached the intended depth, whether rainfall replaced a scheduled watering event, and how greenhouse or field conditions changed over time. Probe depth, soil type, crop zone, irrigation schedule, and cable route should be recorded at installation. Air temperature and humidity can be reviewed with soil wetness to understand drying speed and growing conditions. A consistent environmental record supports practical water management and helps avoid decisions based only on surface appearance.
Maintenance teams should record cleaning, access difficulty, enclosure condition, cable repair, vegetation growth, nearby equipment changes, and the first normal reading after work. Those notes protect the meaning of the curve when old data is reviewed months later.
The environmental point should be part of a named monitoring question. It may explain wetting, drying, wind exposure, thermal movement, cabinet stress, or pressure variation, but that purpose needs to be visible in drawings and reports.
If the reading seems unusual, the team should check the physical condition of the station before drawing conclusions about the asset. Blockage, poor exposure, loose wiring, water entry, and changed surroundings can all create misleading patterns.
The future of Daisy-Chained Digital Thermometer
Future Kingmach Daisy-Chained Digital Thermometer will be grouped around engineering questions. A slope group may include rainfall, soil wetness, displacement, tilt, and pore pressure. A bridge group may include wind, temperature, strain, acceleration, and displacement. A tunnel group may include humidity, temperature, seepage, settlement, and convergence. This grouping is more useful than arranging channels only by sensor family. Owners review risks, not instrument categories. When dashboards and reports follow the risk, environmental data becomes easier for field teams to use during both routine review and abnormal events.
Maintenance teams should record cleaning, access difficulty, enclosure condition, cable repair, vegetation growth, nearby equipment changes, and the first normal reading after work. Those notes protect the meaning of the curve when old data is reviewed months later.
The environmental point should be part of a named monitoring question. It may explain wetting, drying, wind exposure, thermal movement, cabinet stress, or pressure variation, but that purpose needs to be visible in drawings and reports.
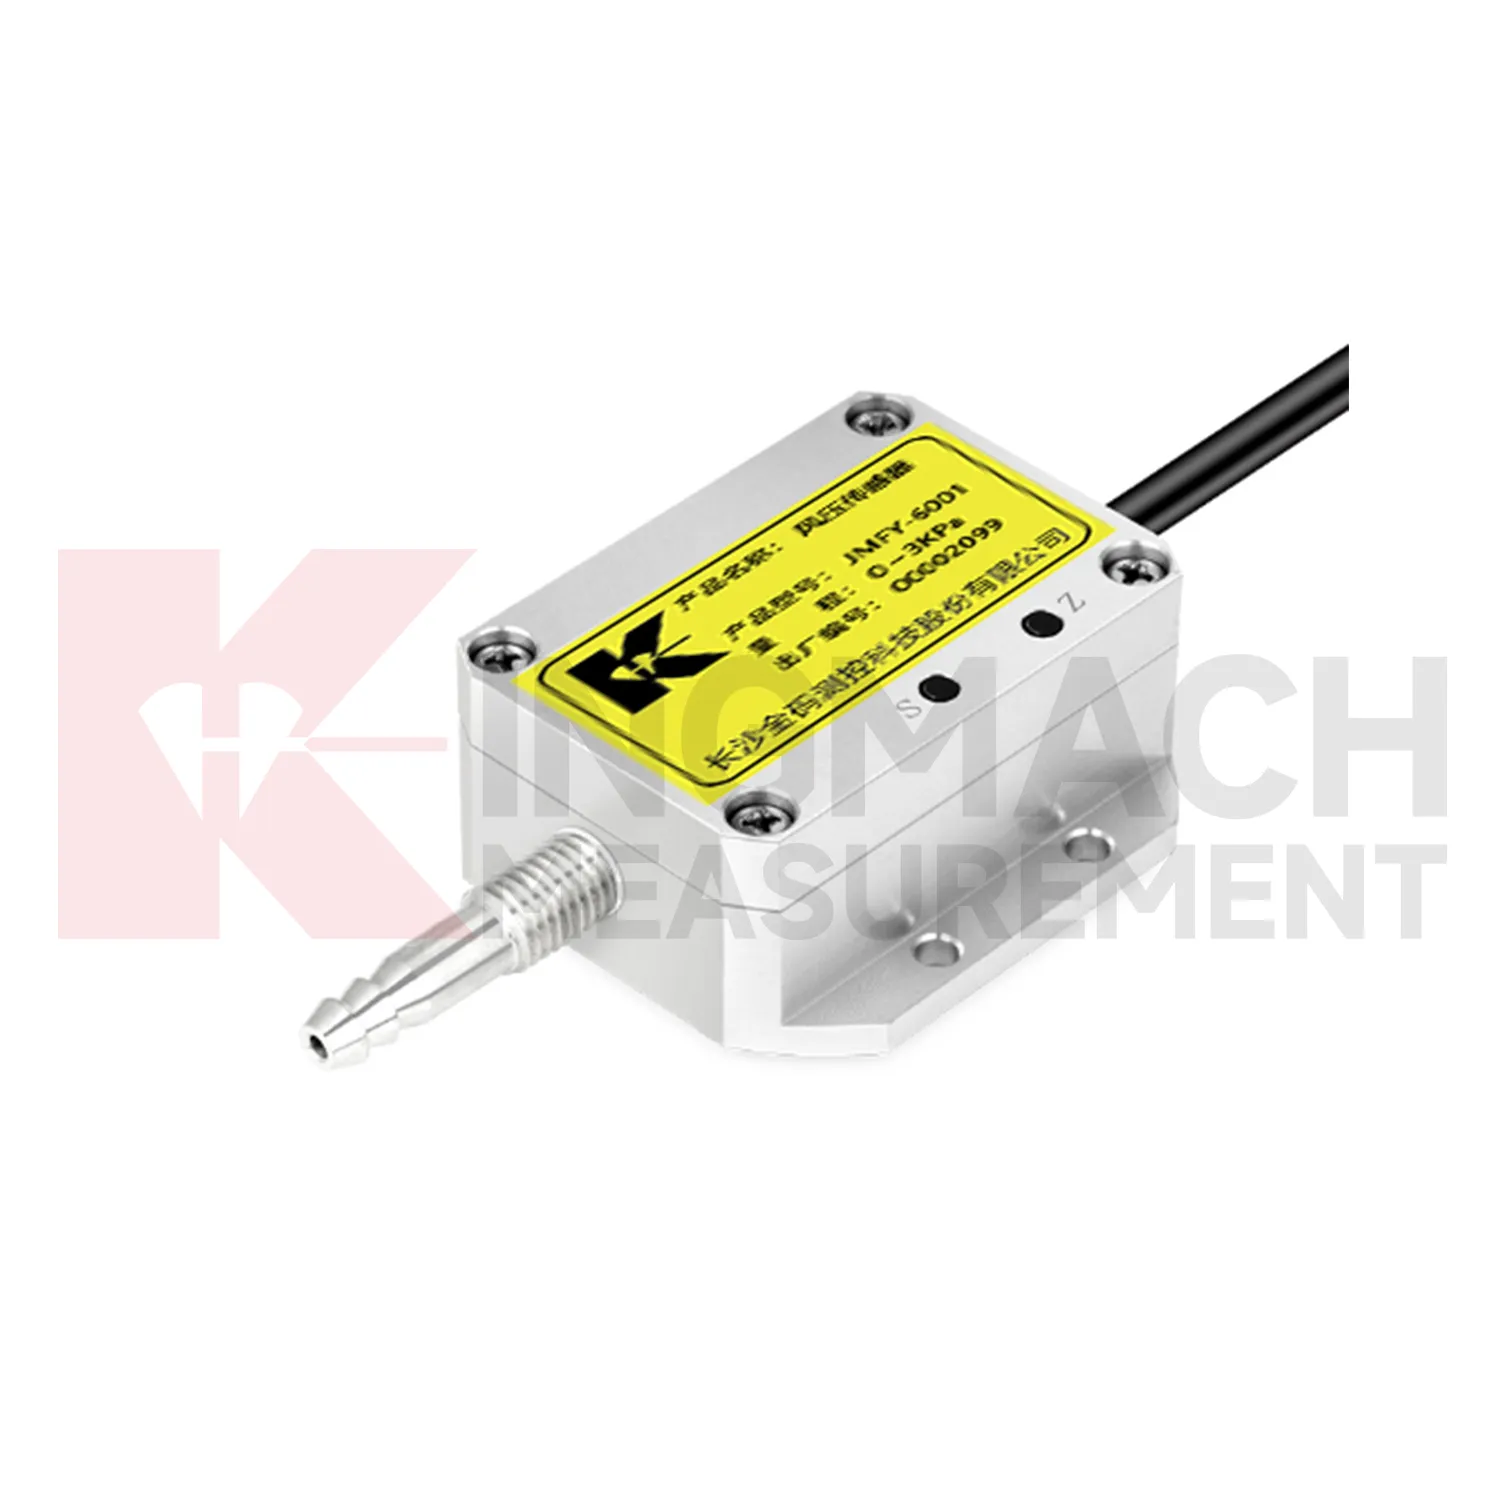
Care & Maintenance of Daisy-Chained Digital Thermometer
Pressure-channel maintenance for Kingmach Daisy-Chained Digital Thermometer should keep the pressure path open, clean, and sealed. Tubes, ports, fittings, housings, cables, and power connections should be inspected after storms, dust exposure, washdown, cabinet work, or mechanical impact. Moisture, blockage, loose tubing, or wrong wiring can create readings that look like a pressure event. Pressure data may be reviewed beside wind, airflow, vibration, and structural response, so channel reliability matters. If pressure behavior does not match surrounding conditions, inspect the physical path before assuming the environment changed. A short maintenance note can prevent a long engineering debate later.
During abnormal events, the first question is not only whether the value crossed a limit. The reviewer should ask what changed around the site, whether the related structure reacted, and whether a field inspection confirmed the same pattern.
Long-term value comes from consistency. A channel that keeps the same location, unit, maintenance history, and linked asset record can support seasonal comparison, post-storm review, and handover between construction and operation teams.
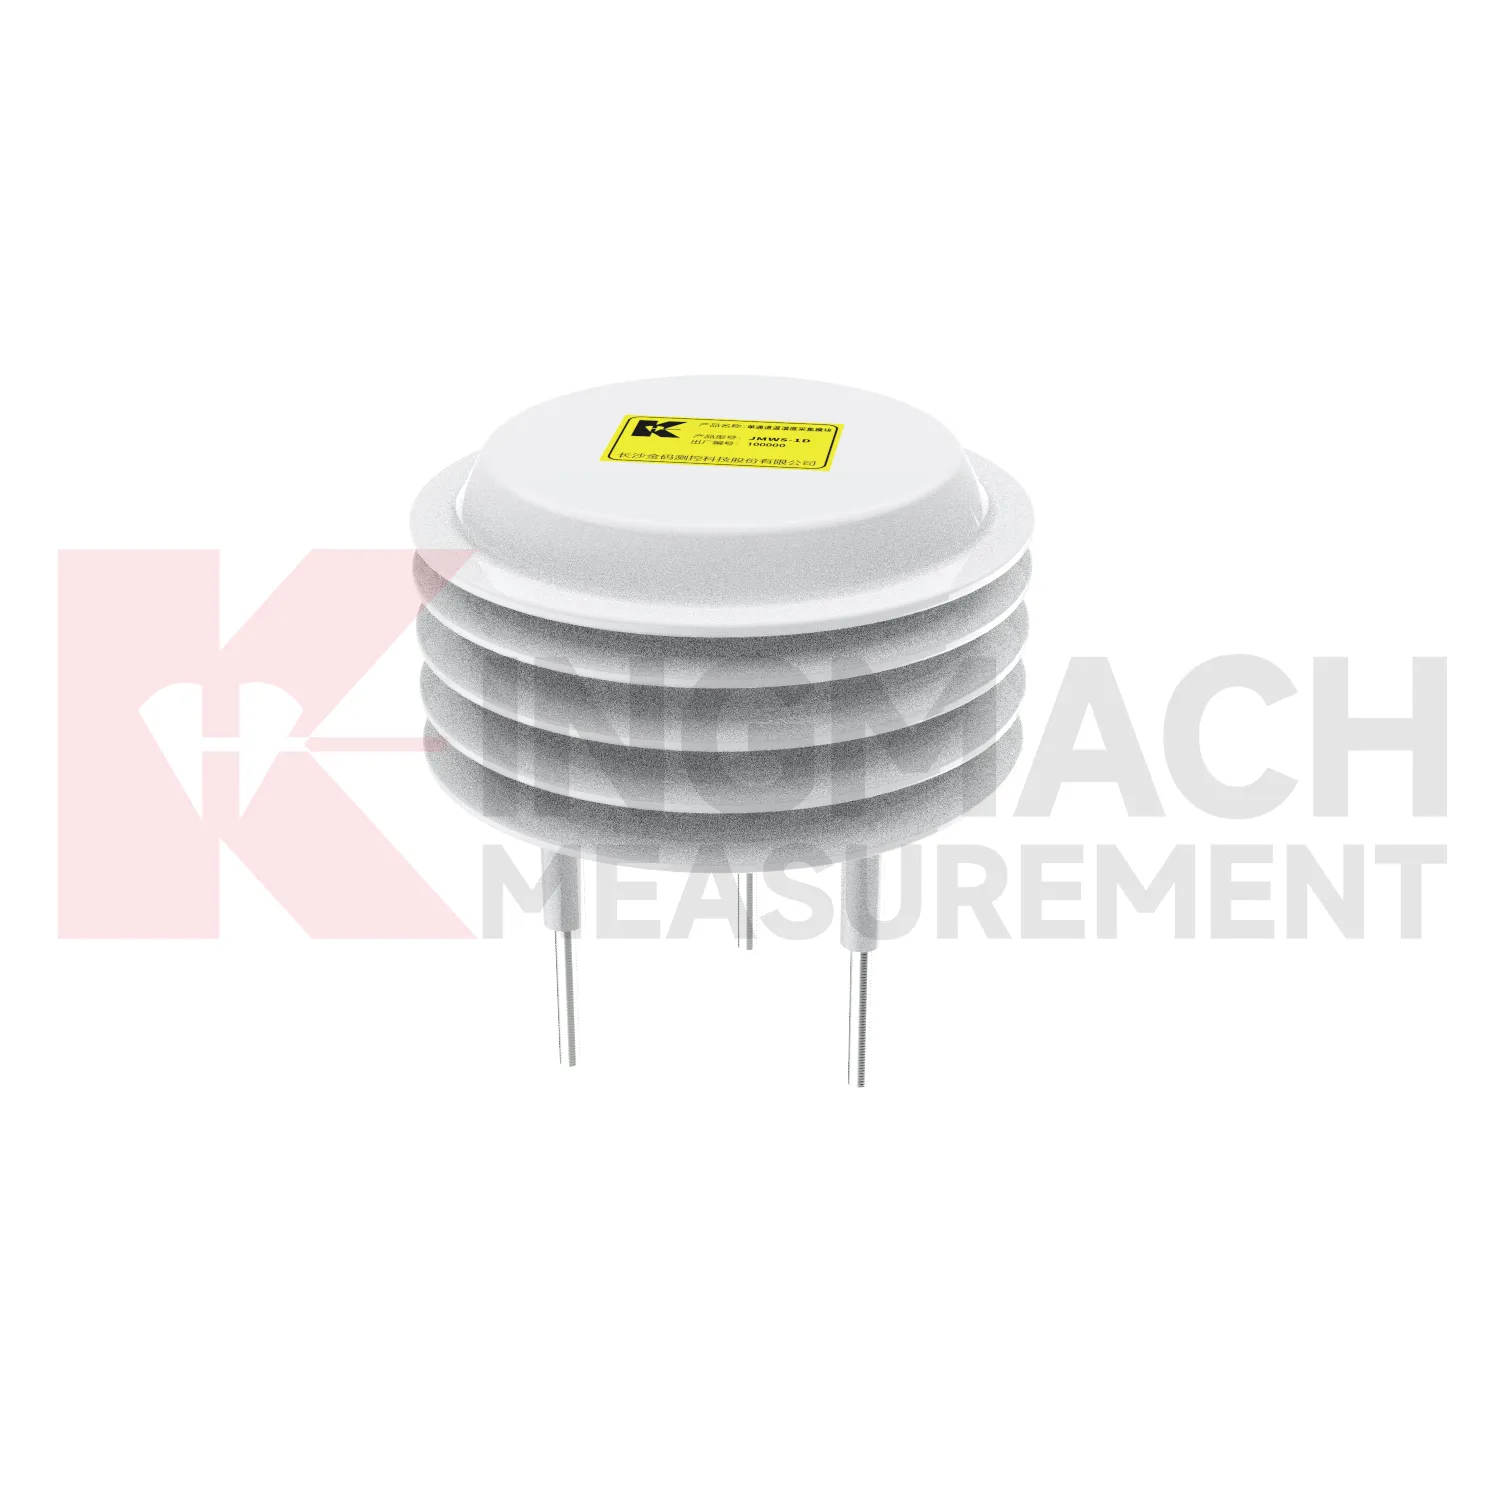
Kingmach Daisy-Chained Digital Thermometer
Kingmach Daisy-Chained Digital Thermometer helps engineering teams read the conditions around a structure before they judge the structure itself. Temperature, humidity, rainfall, wind, pressure, and soil wetness can all change how bridges, tunnels, slopes, buildings, dams, and construction sites behave. A deformation curve after a storm is different from the same curve during a dry week. A strain record during a heat wave needs a temperature background. A cabinet fault in a tunnel may have more to do with moisture than with the instrument connected to it. The purpose of this category is to make those surrounding conditions visible. When environmental records sit beside settlement, displacement, tilt, load, vibration, and inspection notes, engineers can explain why a reading changed instead of only seeing that it changed.
For field teams, this point is most useful when the record shows the condition before the structural response, during the response, and after the site returns to routine operation. The note should include weather timing, inspection access, nearby construction, and whether the linked structural points changed in the same period.
FAQ
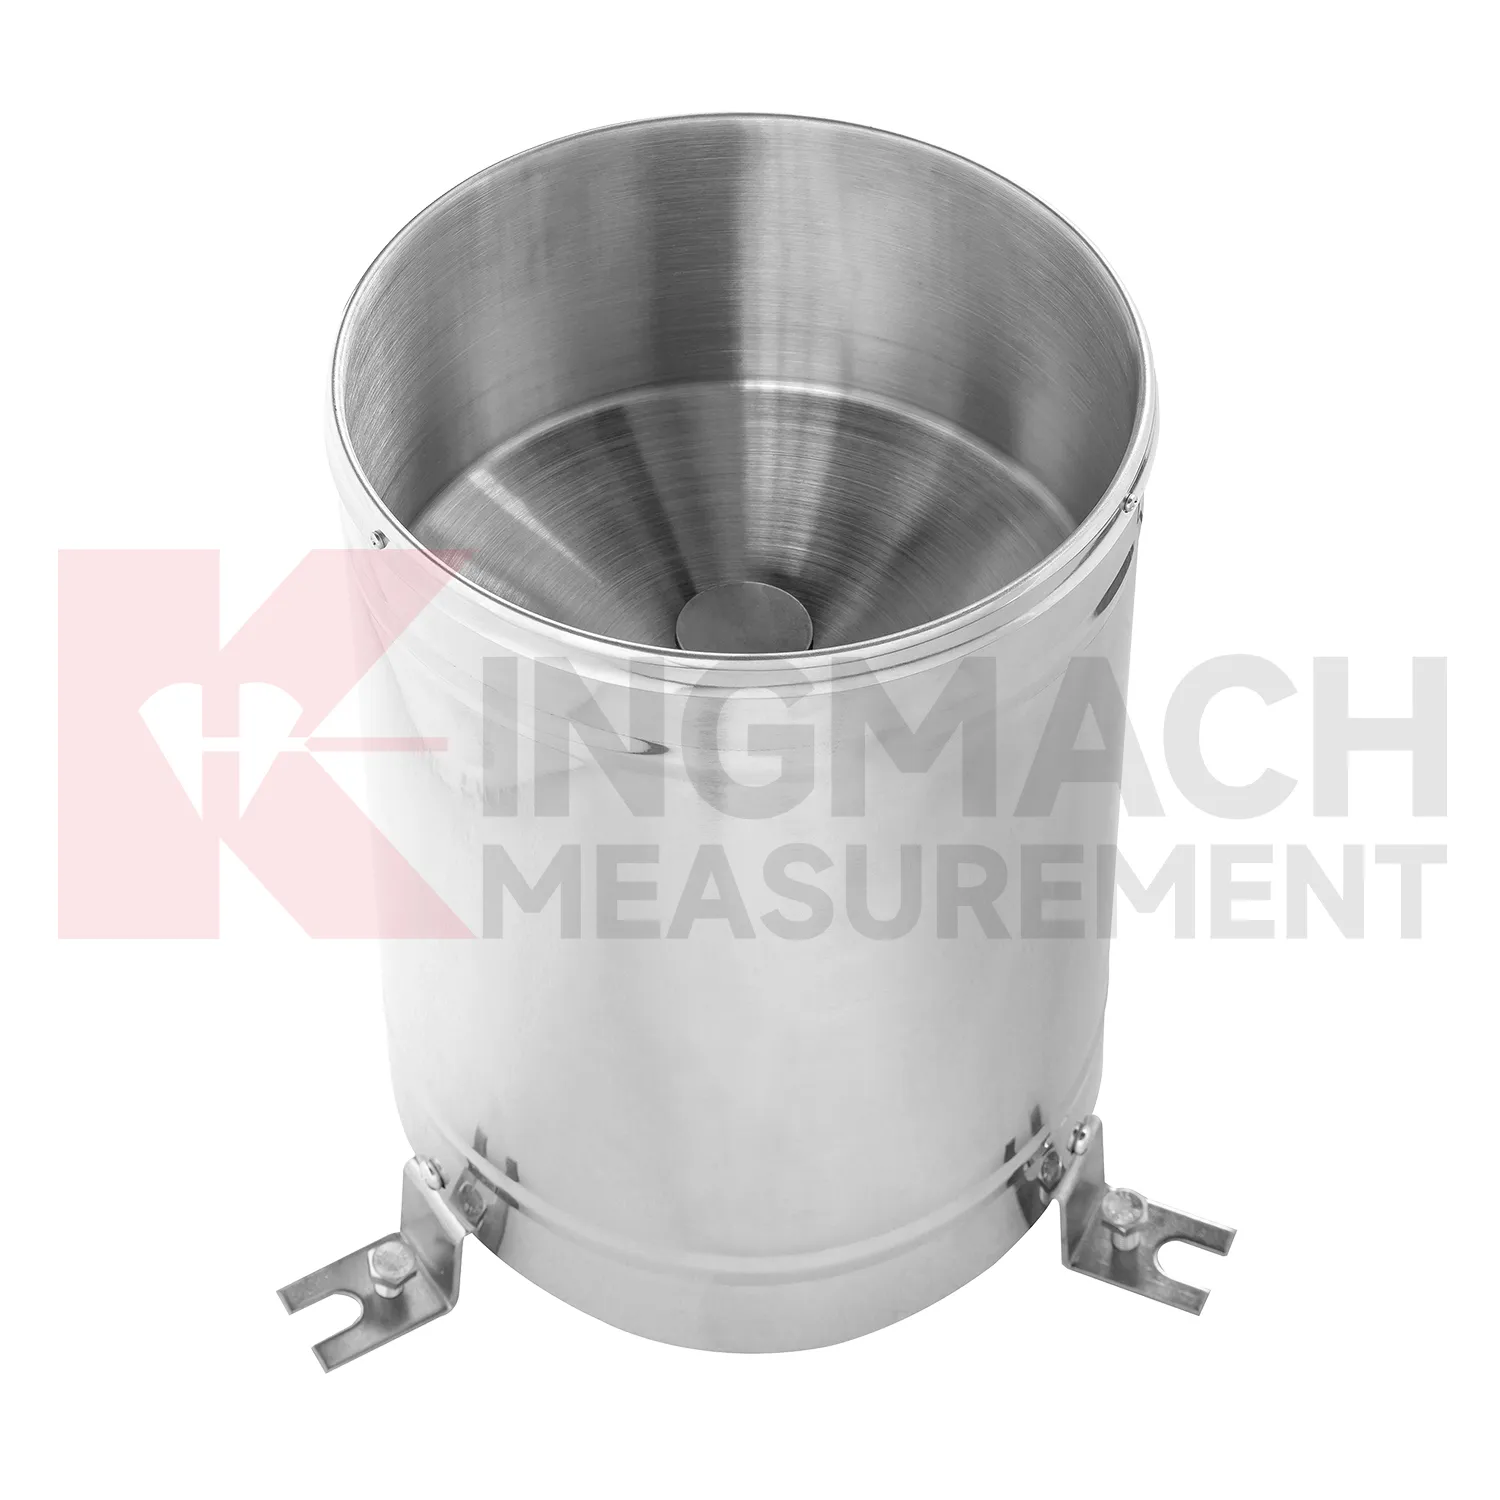
Q: Where should a rain point be placed?
A: It should be level, open to the sky, and away from obstructions, splash sources, roof edges, and debris-prone areas.
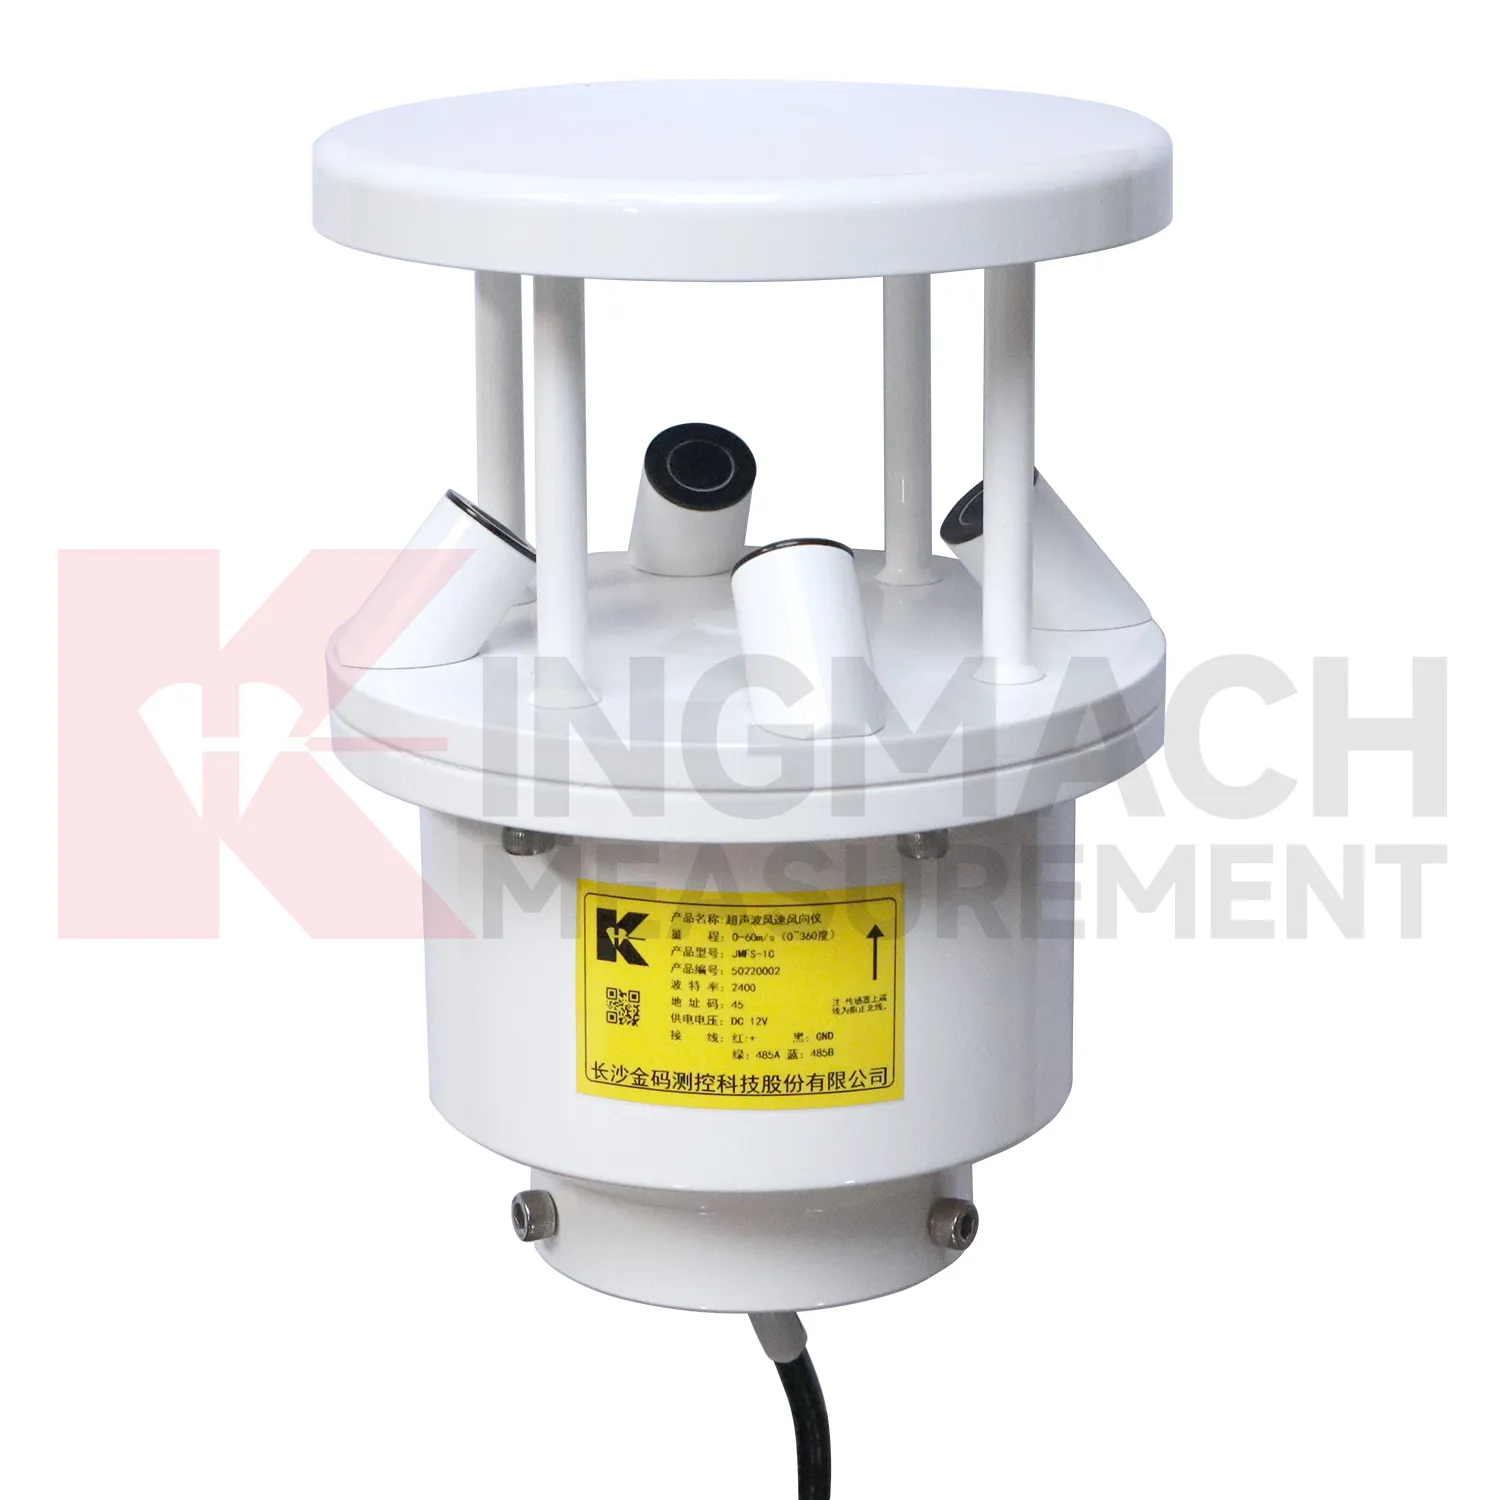
Q: Where should wind be measured?
A: Wind should be measured where airflow represents the asset or work area being reviewed, not behind a wall or sheltered obstruction.
Q: How should soil points be installed?
A: They should have firm contact with the surrounding soil, a recorded depth, protected cable route, and a stable first value.
Q: What should commissioning records include?
A: Include point location, measured condition, unit, mounting photo, cable route, power source, data channel, and linked structural record.
Q: Why are photos useful?
A: Photos help future reviewers understand exposure, mounting, cable routing, and whether later site changes affected readings.
Maintenance teams should record cleaning, access difficulty, enclosure condition, cable repair, vegetation growth, nearby equipment changes, and the first normal reading after work. Those notes protect the meaning of the curve when old data is reviewed months later.
Reviews
David Wilson
We purchased displacement transducers and settlement sensors, and the quality exceeded our expectations. Easy installation and reliable performance.
James Thompson
The tiltmeters and accelerometers are very sensitive and provide precise data. Perfect for our structural health monitoring system.
Latest Inquiries
To protect the privacy of our buyers, only public service email domains like Gmail, Yahoo, and MSN will be displayed. Additionally, only a limited portion of the inquiry content will be shown.
Amelia***@gmail.comSingapore
Hello, I am looking for visualization software for monitoring system data analysis. Please let me kn...
Emma***@gmail.comCanada
Dear Sir/Madam, we are interested in displacement transducers and settlement sensors for a geotechni...
Related product categories
- wind pressure sensor
- ultrasonic wind speed and direction sensor
- wind speed and direction sensor
- wind speed and wind direction sensor
- wind speed and direct sensor
- wireless wind speed and direction sensor
- wind direction and speed sensor
- wind speed and direction sensors
- tipping bucket rain gauge
- tipping bucket rain gauge resolution 0.2 mm standard
- tipping bucket rain gauges
- tipping bucket rain gauge resolution 0.1 mm 0.2 mm standard