 ar
ar bg
bg hr
hr cs
cs da
da nl
nl fi
fi fr
fr de
de el
el hi
hi it
it ko
ko no
no pl
pl pt
pt ro
ro ru
ru es
es sv
sv tl
tl iw
iw id
id lv
lv lt
lt sr
sr sk
sk sl
sl uk
uk vi
vi et
et hu
hu th
th tr
tr fa
fa ms
ms hy
hy ka
ka ur
ur bn
bn mn
mn ta
ta kk
kk uz
uz ku
ku
Visualization Software
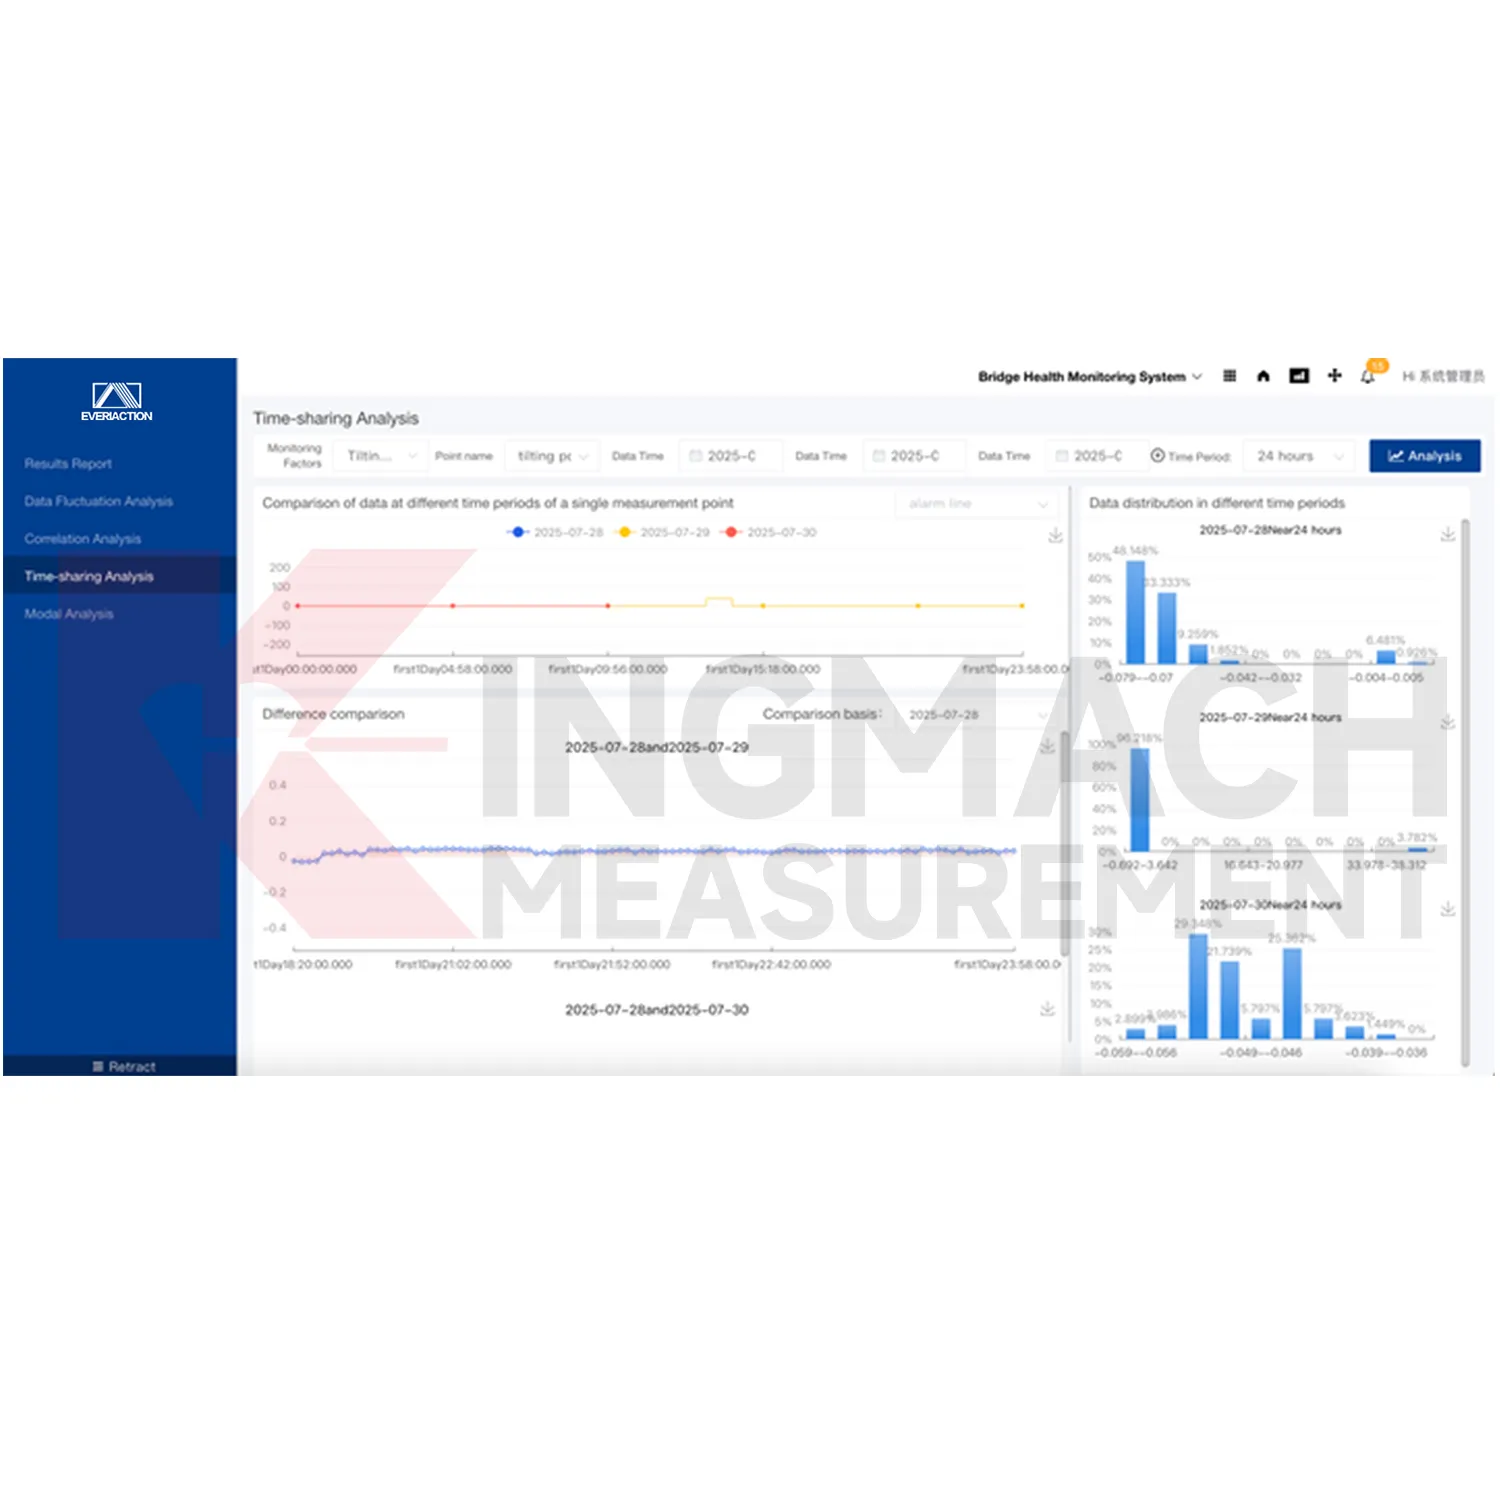
Kingmach Visualization Software refers to the Monitoring system software platform, also described in the local files as the Cloud Platform. It is based on Internet of Things, big data, and cloud computing technologies for all-round monitoring of civil engineering structure safety. The platform receives data from monitoring devices, stores it, filters it, analyzes it, displays it, and supports project management. It is intended for infrastructure and engineering assets where multi-source readings need to be reviewed together instead of scattered across separate devices or spreadsheets.
Application of Visualization Software
Dam and hydraulic structure monitoring uses Kingmach Visualization Software to manage water level, seepage, deformation, settlement, temperature, pressure, and gallery inspection records. These assets require long-term data continuity and careful alarm handling. The platform can store multi-dimensional data, show trends, and maintain project documents around the same asset. When an abnormal pattern appears, reviewers can compare the value with water level, rainfall, maintenance notes, and related sensors before deciding the next field action.
The future of Visualization Software
Big data workflows will shape the future of Kingmach Visualization Software. Long-term structural monitoring creates large volumes of readings, alarms, inspection notes, and project documents. Raw storage alone is not enough; the platform must help filter, analyze, compare, visualize, and report those records. Over time, historical baselines will become more useful for judging whether a new event is ordinary, seasonal, construction-related, or abnormal. This makes data history an active part of engineering management.
Care & Maintenance of Visualization Software
Dashboard maintenance for Kingmach Visualization Software should follow the needs of users, not just the number of available widgets. Operators need quick status, active alarms, and recent data quality. Engineers may need trend comparison, related channels, statistics, and event notes. Managers may need report summaries and project status. Review dashboard layouts after real use begins, then remove clutter and add views that help decisions. A clean visual layout keeps important changes easier to notice.
Kingmach Visualization Software
For project managers, Kingmach Visualization Software gives each monitored asset a defined operating file instead of a loose collection of screens. The team can maintain project basics, live status, inspection notes, maintenance activity, alarm levels, and documents under the same project name. This is useful when an owner needs to explain who checked the data, what changed on site, which alarm was acknowledged, and which report followed. The platform turns daily monitoring into a traceable management routine, so later audits can follow the project history without rebuilding it from scattered folders.
FAQ
Q: How should a project be prepared?
A: Define asset folders, monitoring zones, measuring points, units, alert grades, and report needs before launch.
Q: What should be tested at go-live?
A: Test incoming values, time order, engineering units, graph refresh, alarm trigger, and export output.
Q: Why does alarm logic need review?
A: Different sensor categories and risk levels may need different limits, rates, and escalation steps.
Q: How should files stay current?
A: Update drawings, point lists, photos, inspection notes, maintenance logs, and reports when the site changes.
Q: What should follow a platform update?
A: Run a short acceptance check on live values, graph pages, alerts, exports, accounts, and stored files.
Reviews
Michael Anderson
The strain gauges and load cells are extremely accurate and stable. They performed very well in our bridge monitoring project. Highly recommended!
Andrew Lee
The visualization software is intuitive and powerful. It helps us analyze monitoring data efficiently.
Latest Inquiries
To protect the privacy of our buyers, only public service email domains like Gmail, Yahoo, and MSN will be displayed. Additionally, only a limited portion of the inquiry content will be shown.
Evelyn***@gmail.comSouth Africa
Hi, we are a contractor working on tunnel construction and need settlement sensors and displacement ...
Mia***@gmail.comNetherlands
Dear team, we are interested in your readouts & data loggers compatible with multiple sensors. Do yo...
Related product categories
- Monitoring Software Suite
- Monitoring system software platform
- Environmental Monitoring
- Visualization Software
- GPS Displacement Monitoring System
- Integrated Monitoring Station
- Settlement Monitoring Rod
- Structural Health Monitoring (SHM) System
- Structural Monitoring Cloud Platform
- IoT Online Monitoring System
- Monitoring System Platform & Services
- Engineering Pulse Intelligent Monitoring Cloud Platform